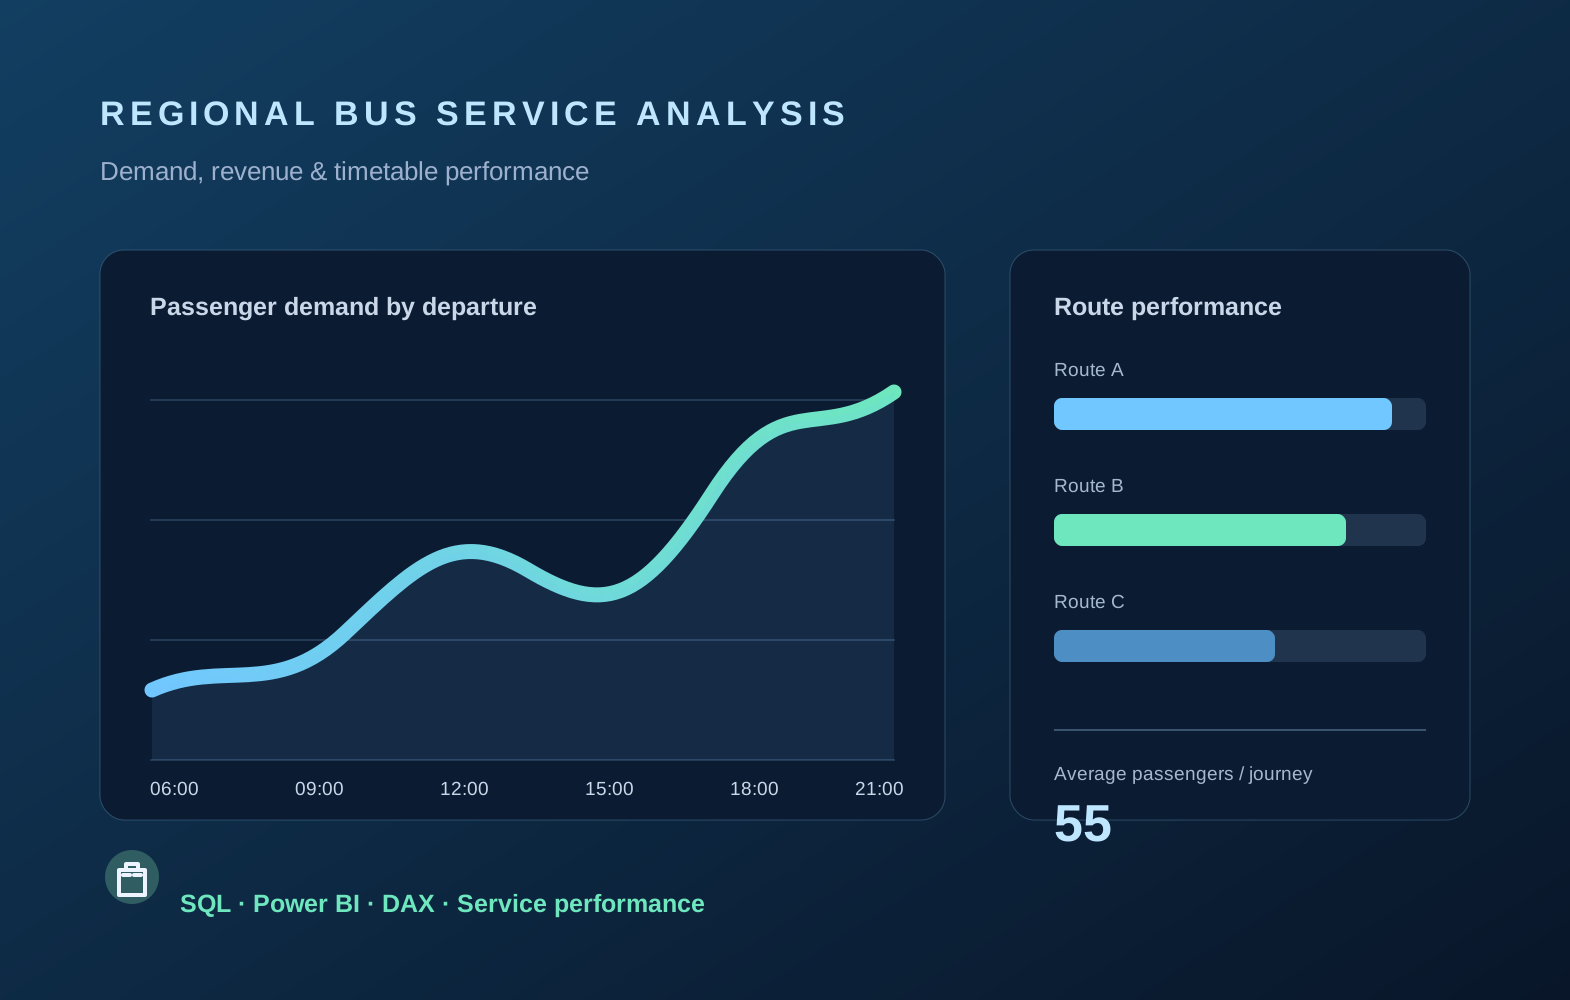
Transport service analysis
From transaction data to service-level performance insight.
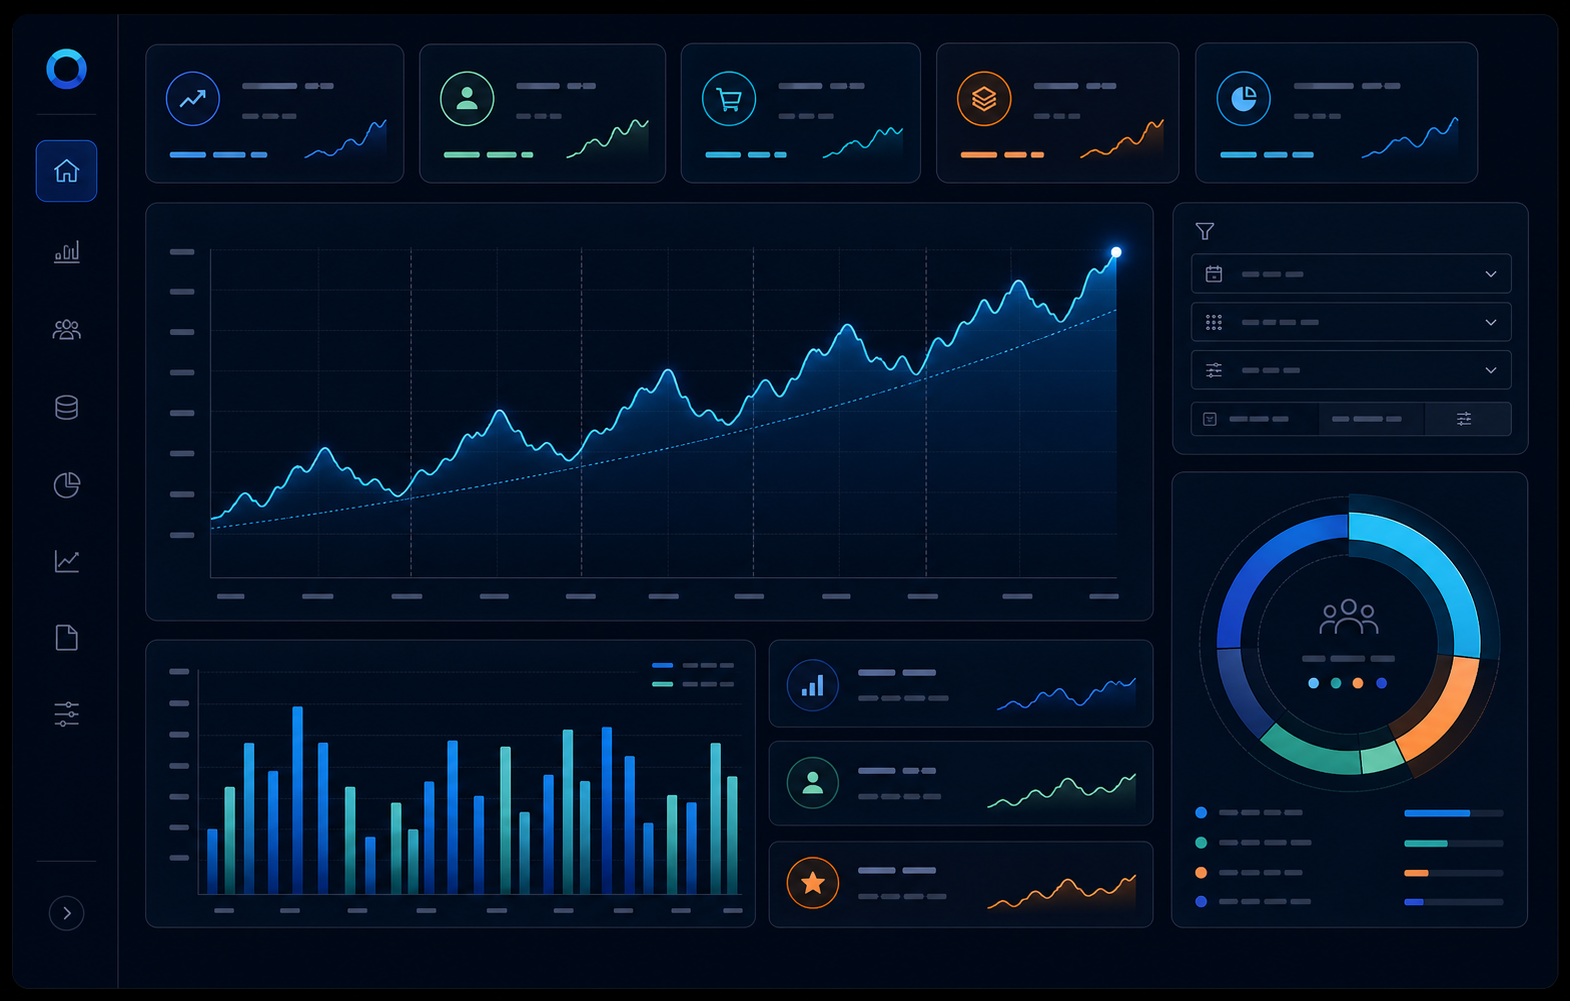
Built a six-page synthetic-data case study covering network demand, fare revenue, recurring services, booking behaviour, timetable effects, origin-destination flows, and a weekday-departure heatmap.
- Analysed 484,230 transaction records at the correct grain, using passenger totals and distinct journey counts to measure demand per service.
- Used CTEs, window shares, and dense ranking to separate high-demand departures from high-value revenue services.
- Published the documented SQL, synthetic dataset, Power BI dashboard, and final report screenshots in a reproducible case study.